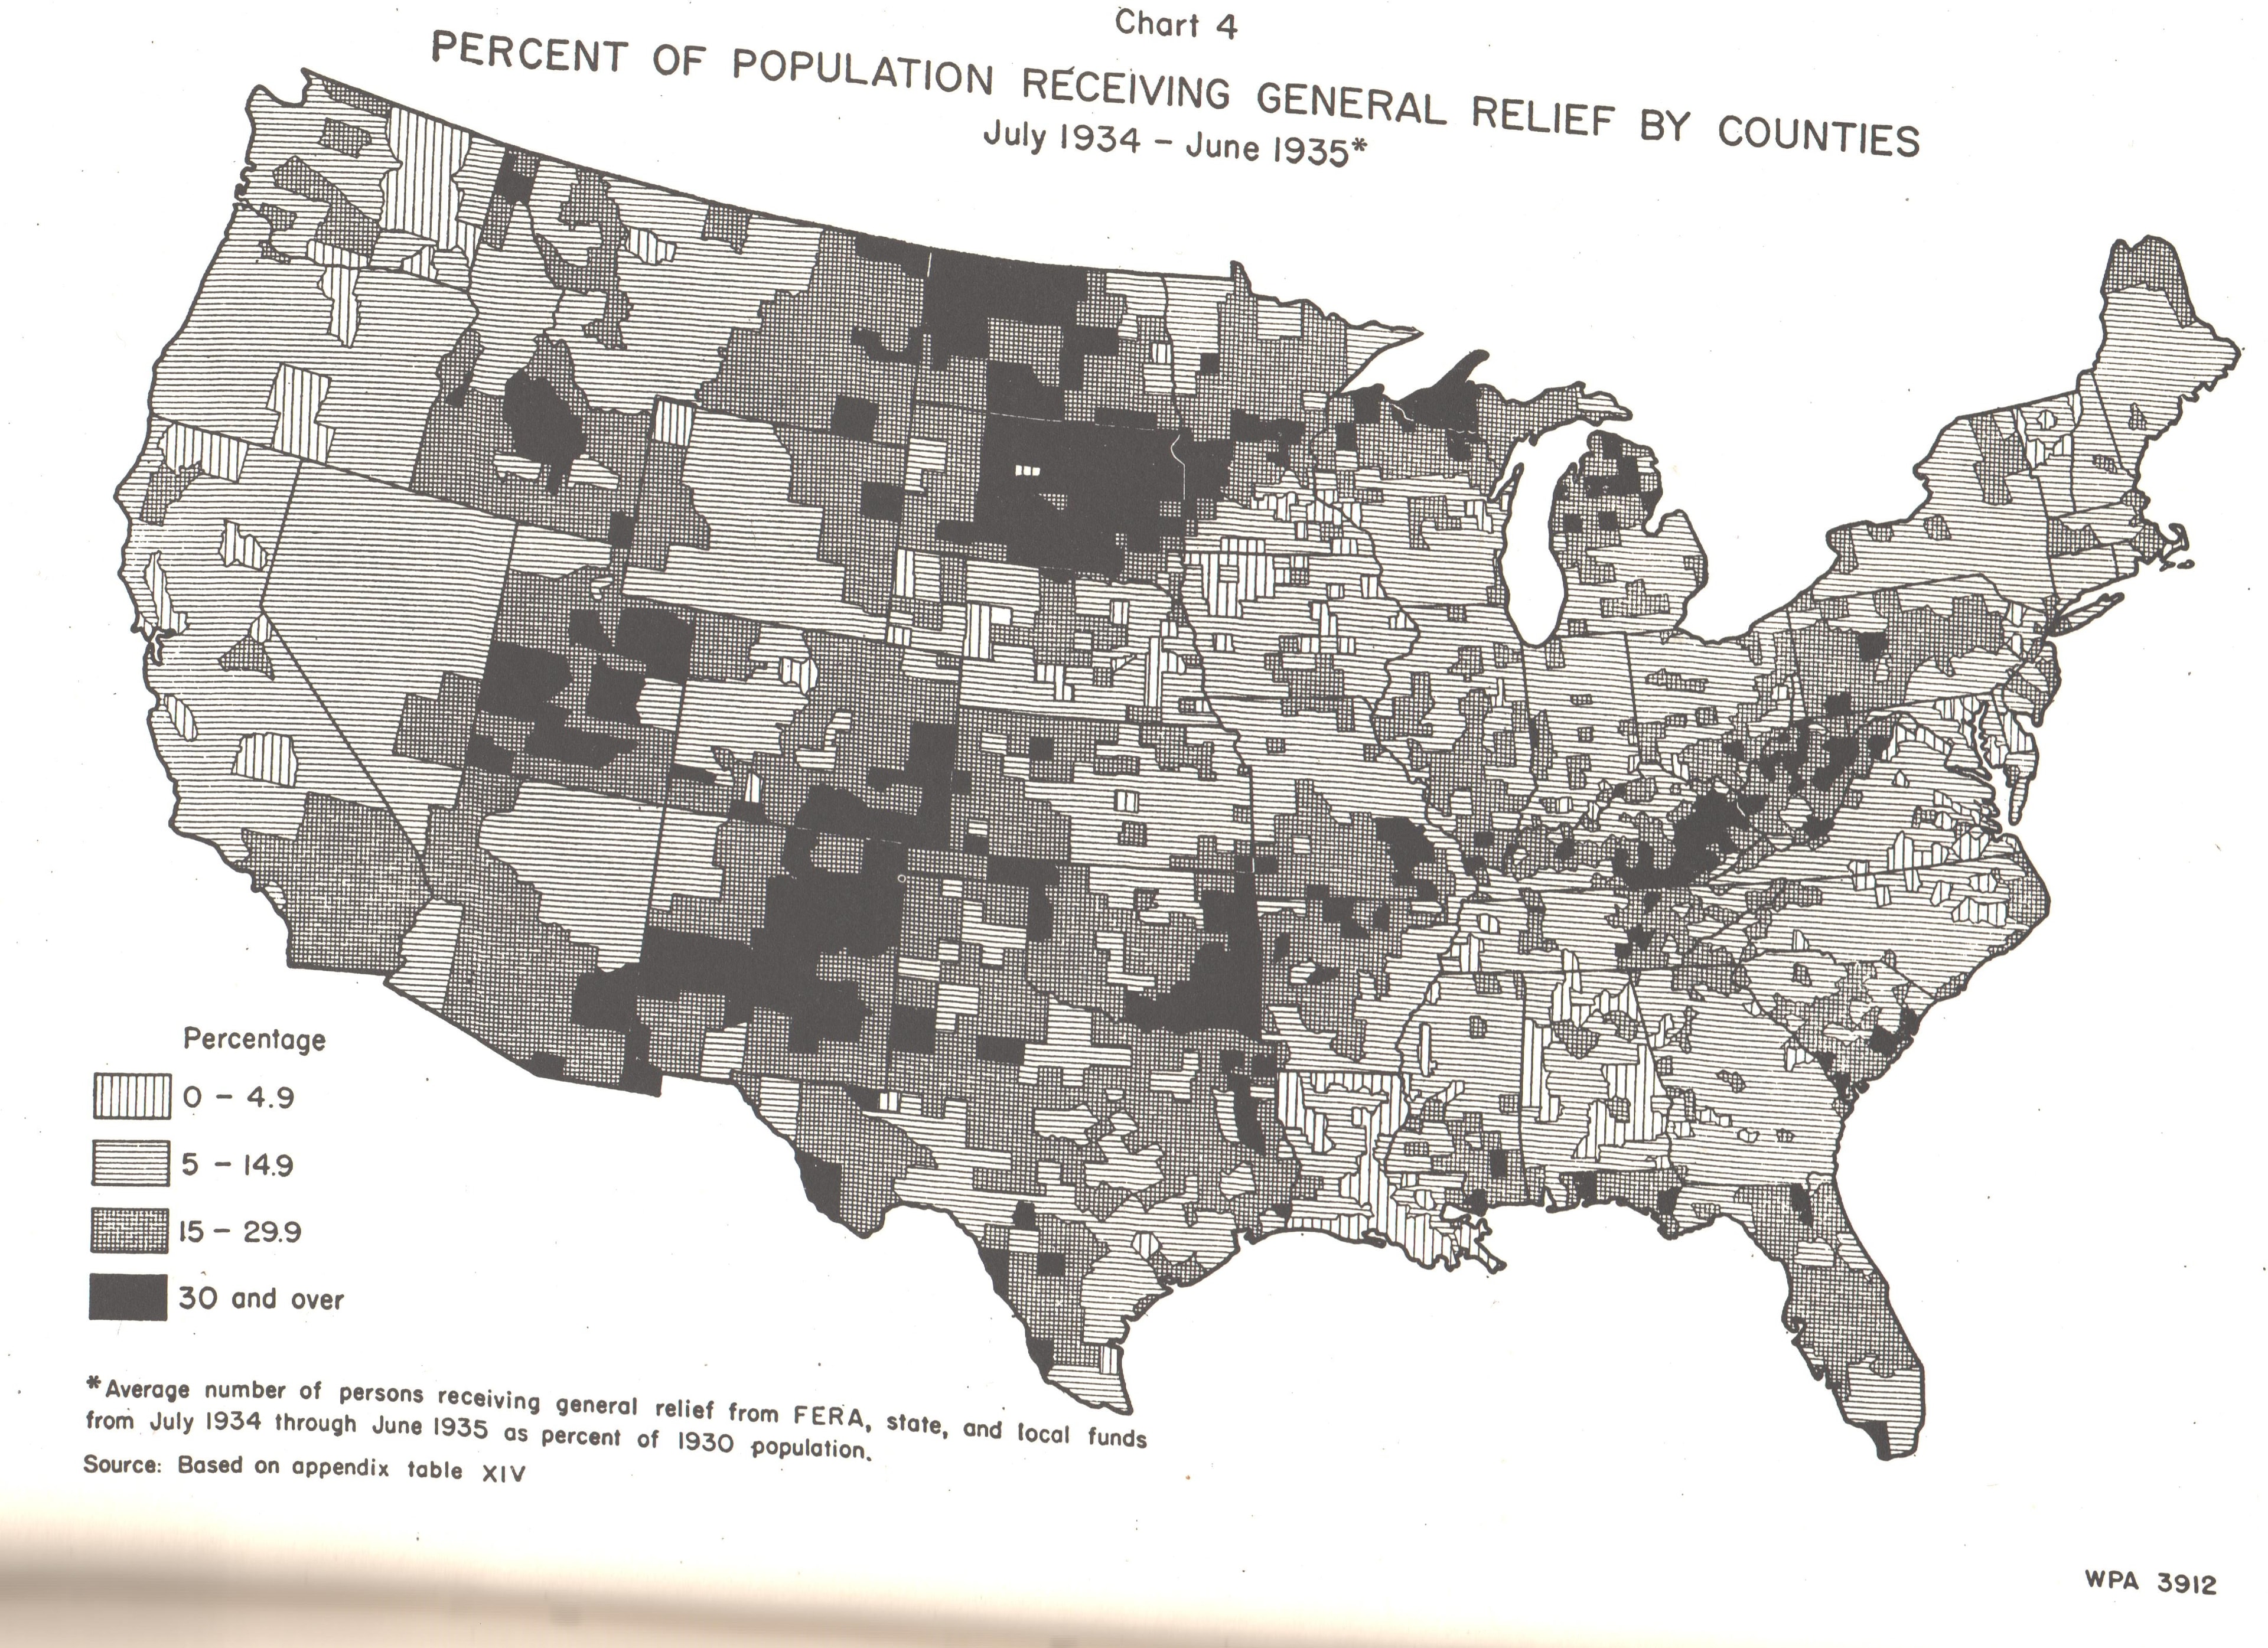
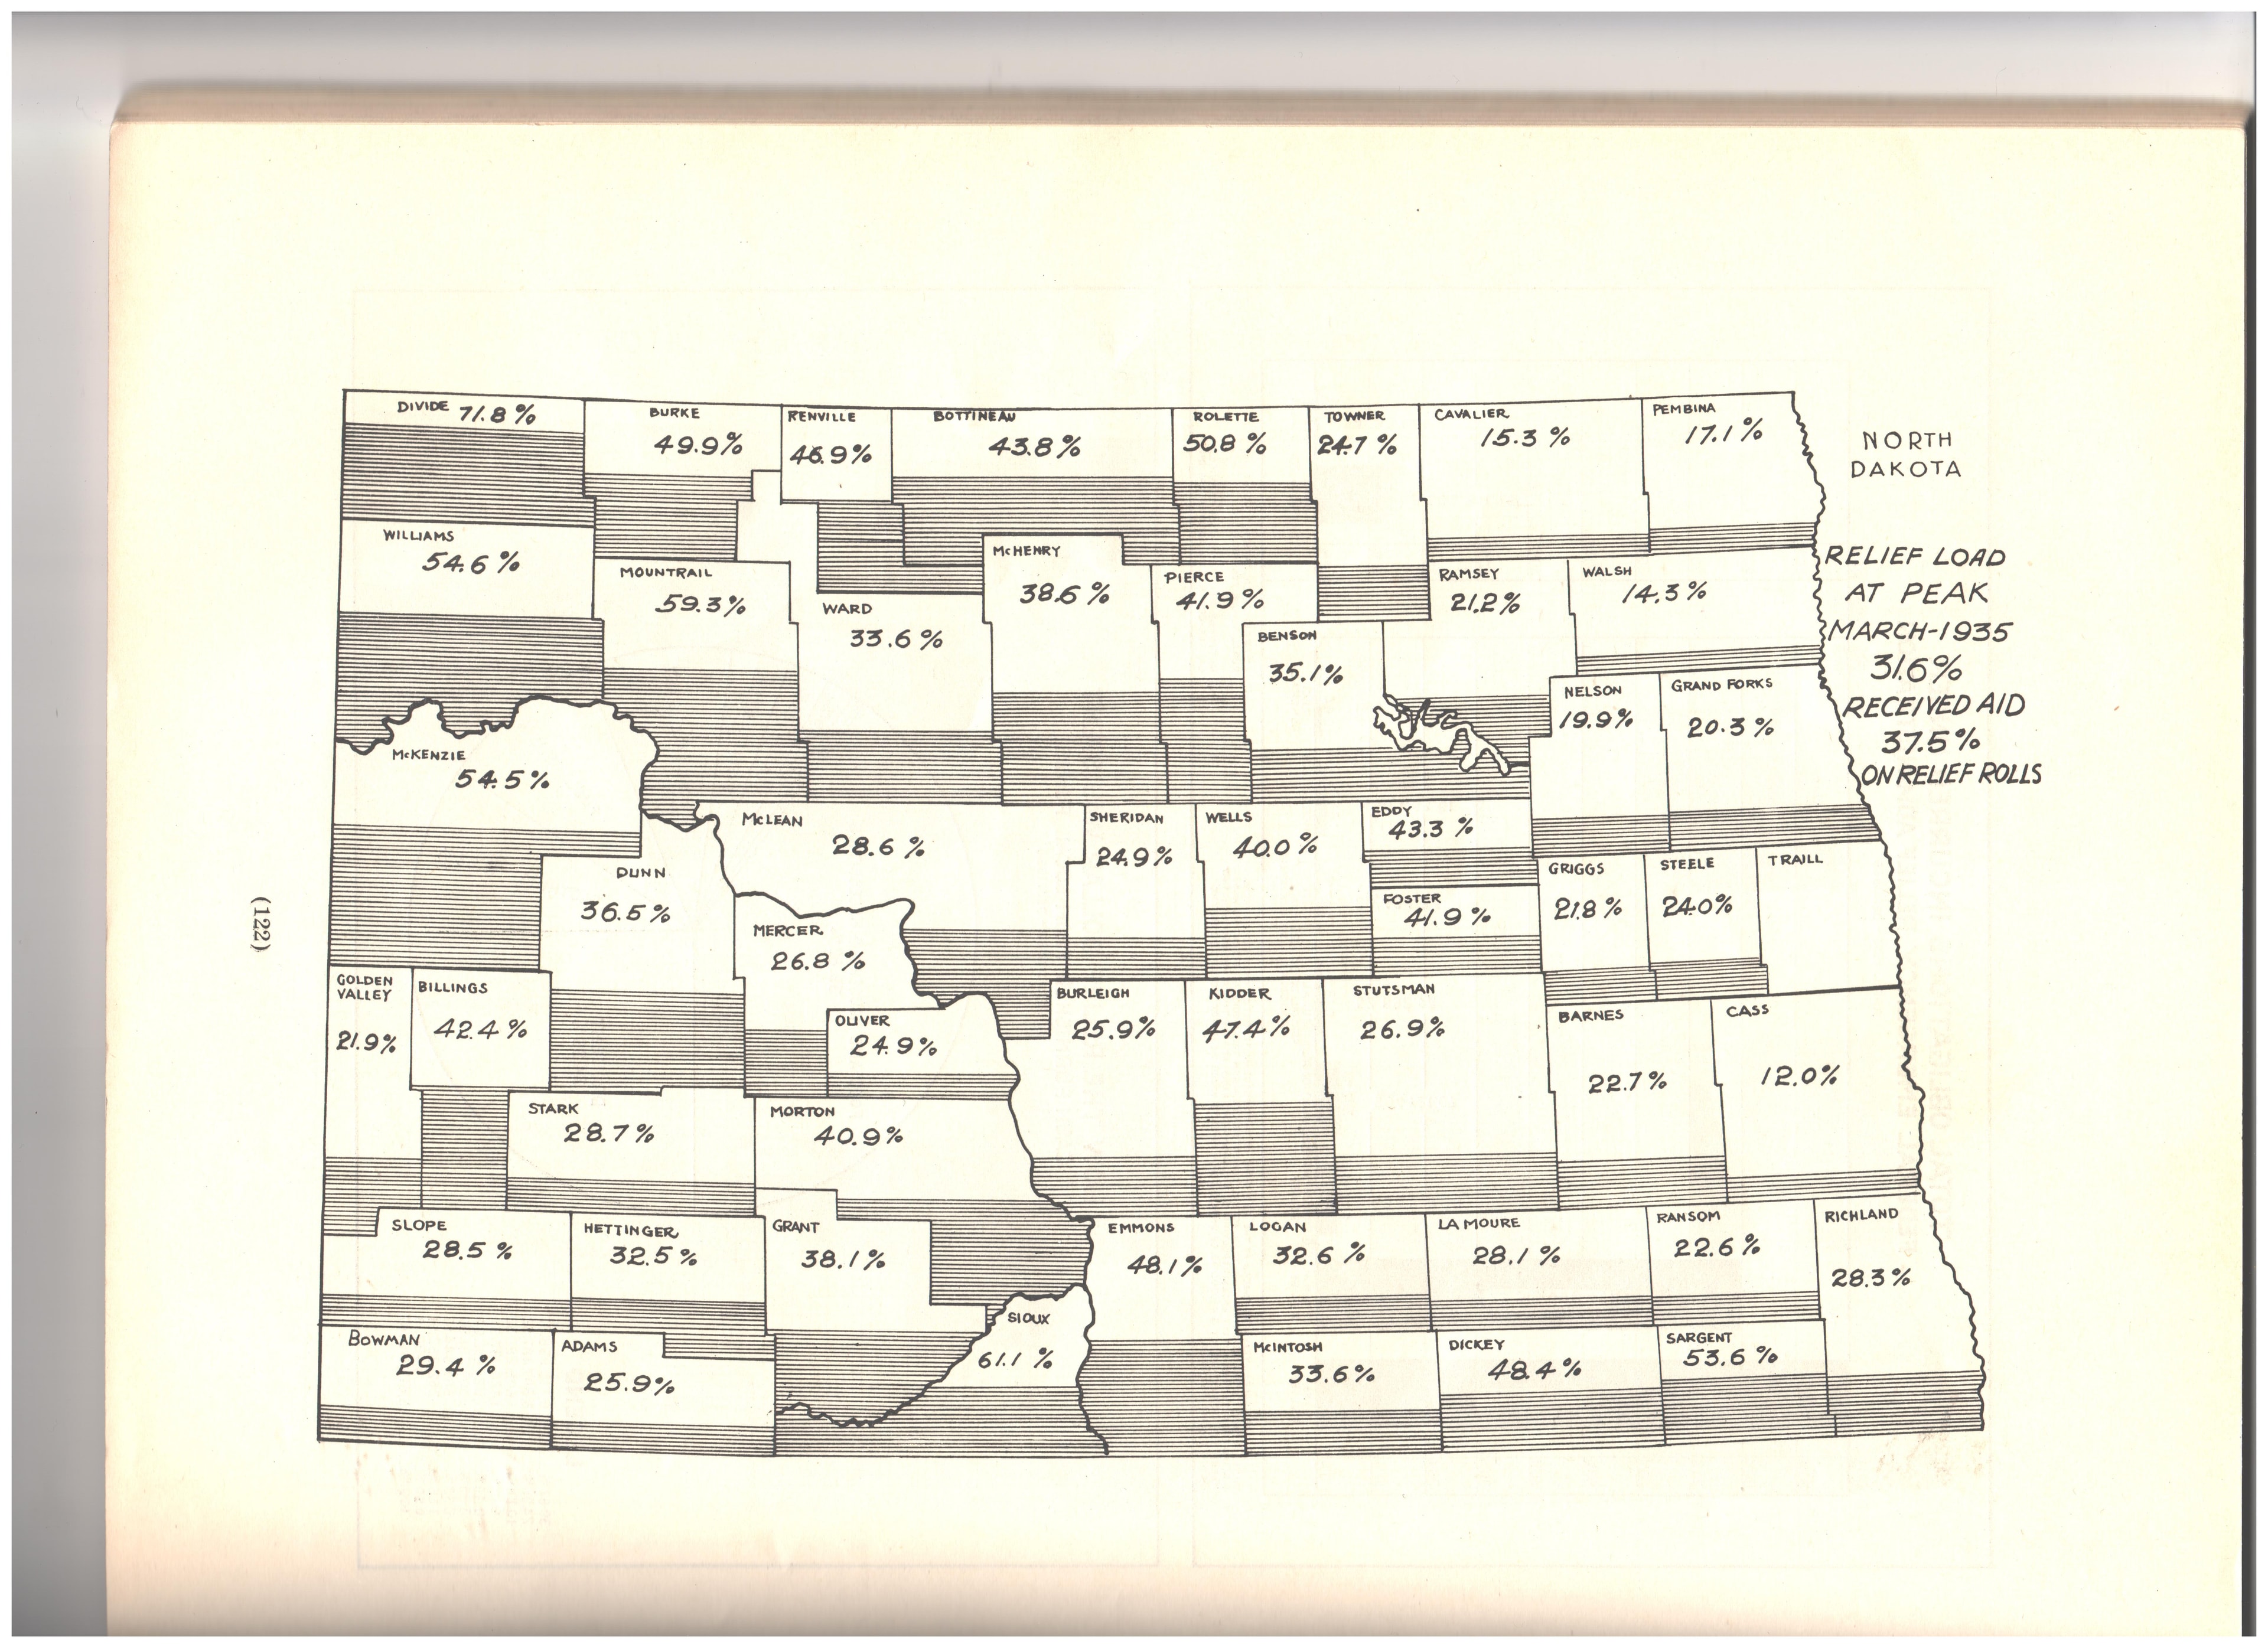
By 1935, some counties had as many as 70 per cent of their residents on relief, and many more had more than half. (Graphic courtesy Tweton and Rylance, Years Of Despair: North Dakota In The Depression. Original available at the Elwyn B. Robinson Department of Special Collections, Chester Fritz Library, UND)
North Dakota Relief Load at Peak, March 1935: 31.6% received aid, 37.5% on relief rolls. (Graphic courtesy Tweton and Rylance, Years Of Despair: North Dakota In The Depression. Original available at the Elwyn B. Robinson Department of Special Collections, Chester Fritz Library, UND)
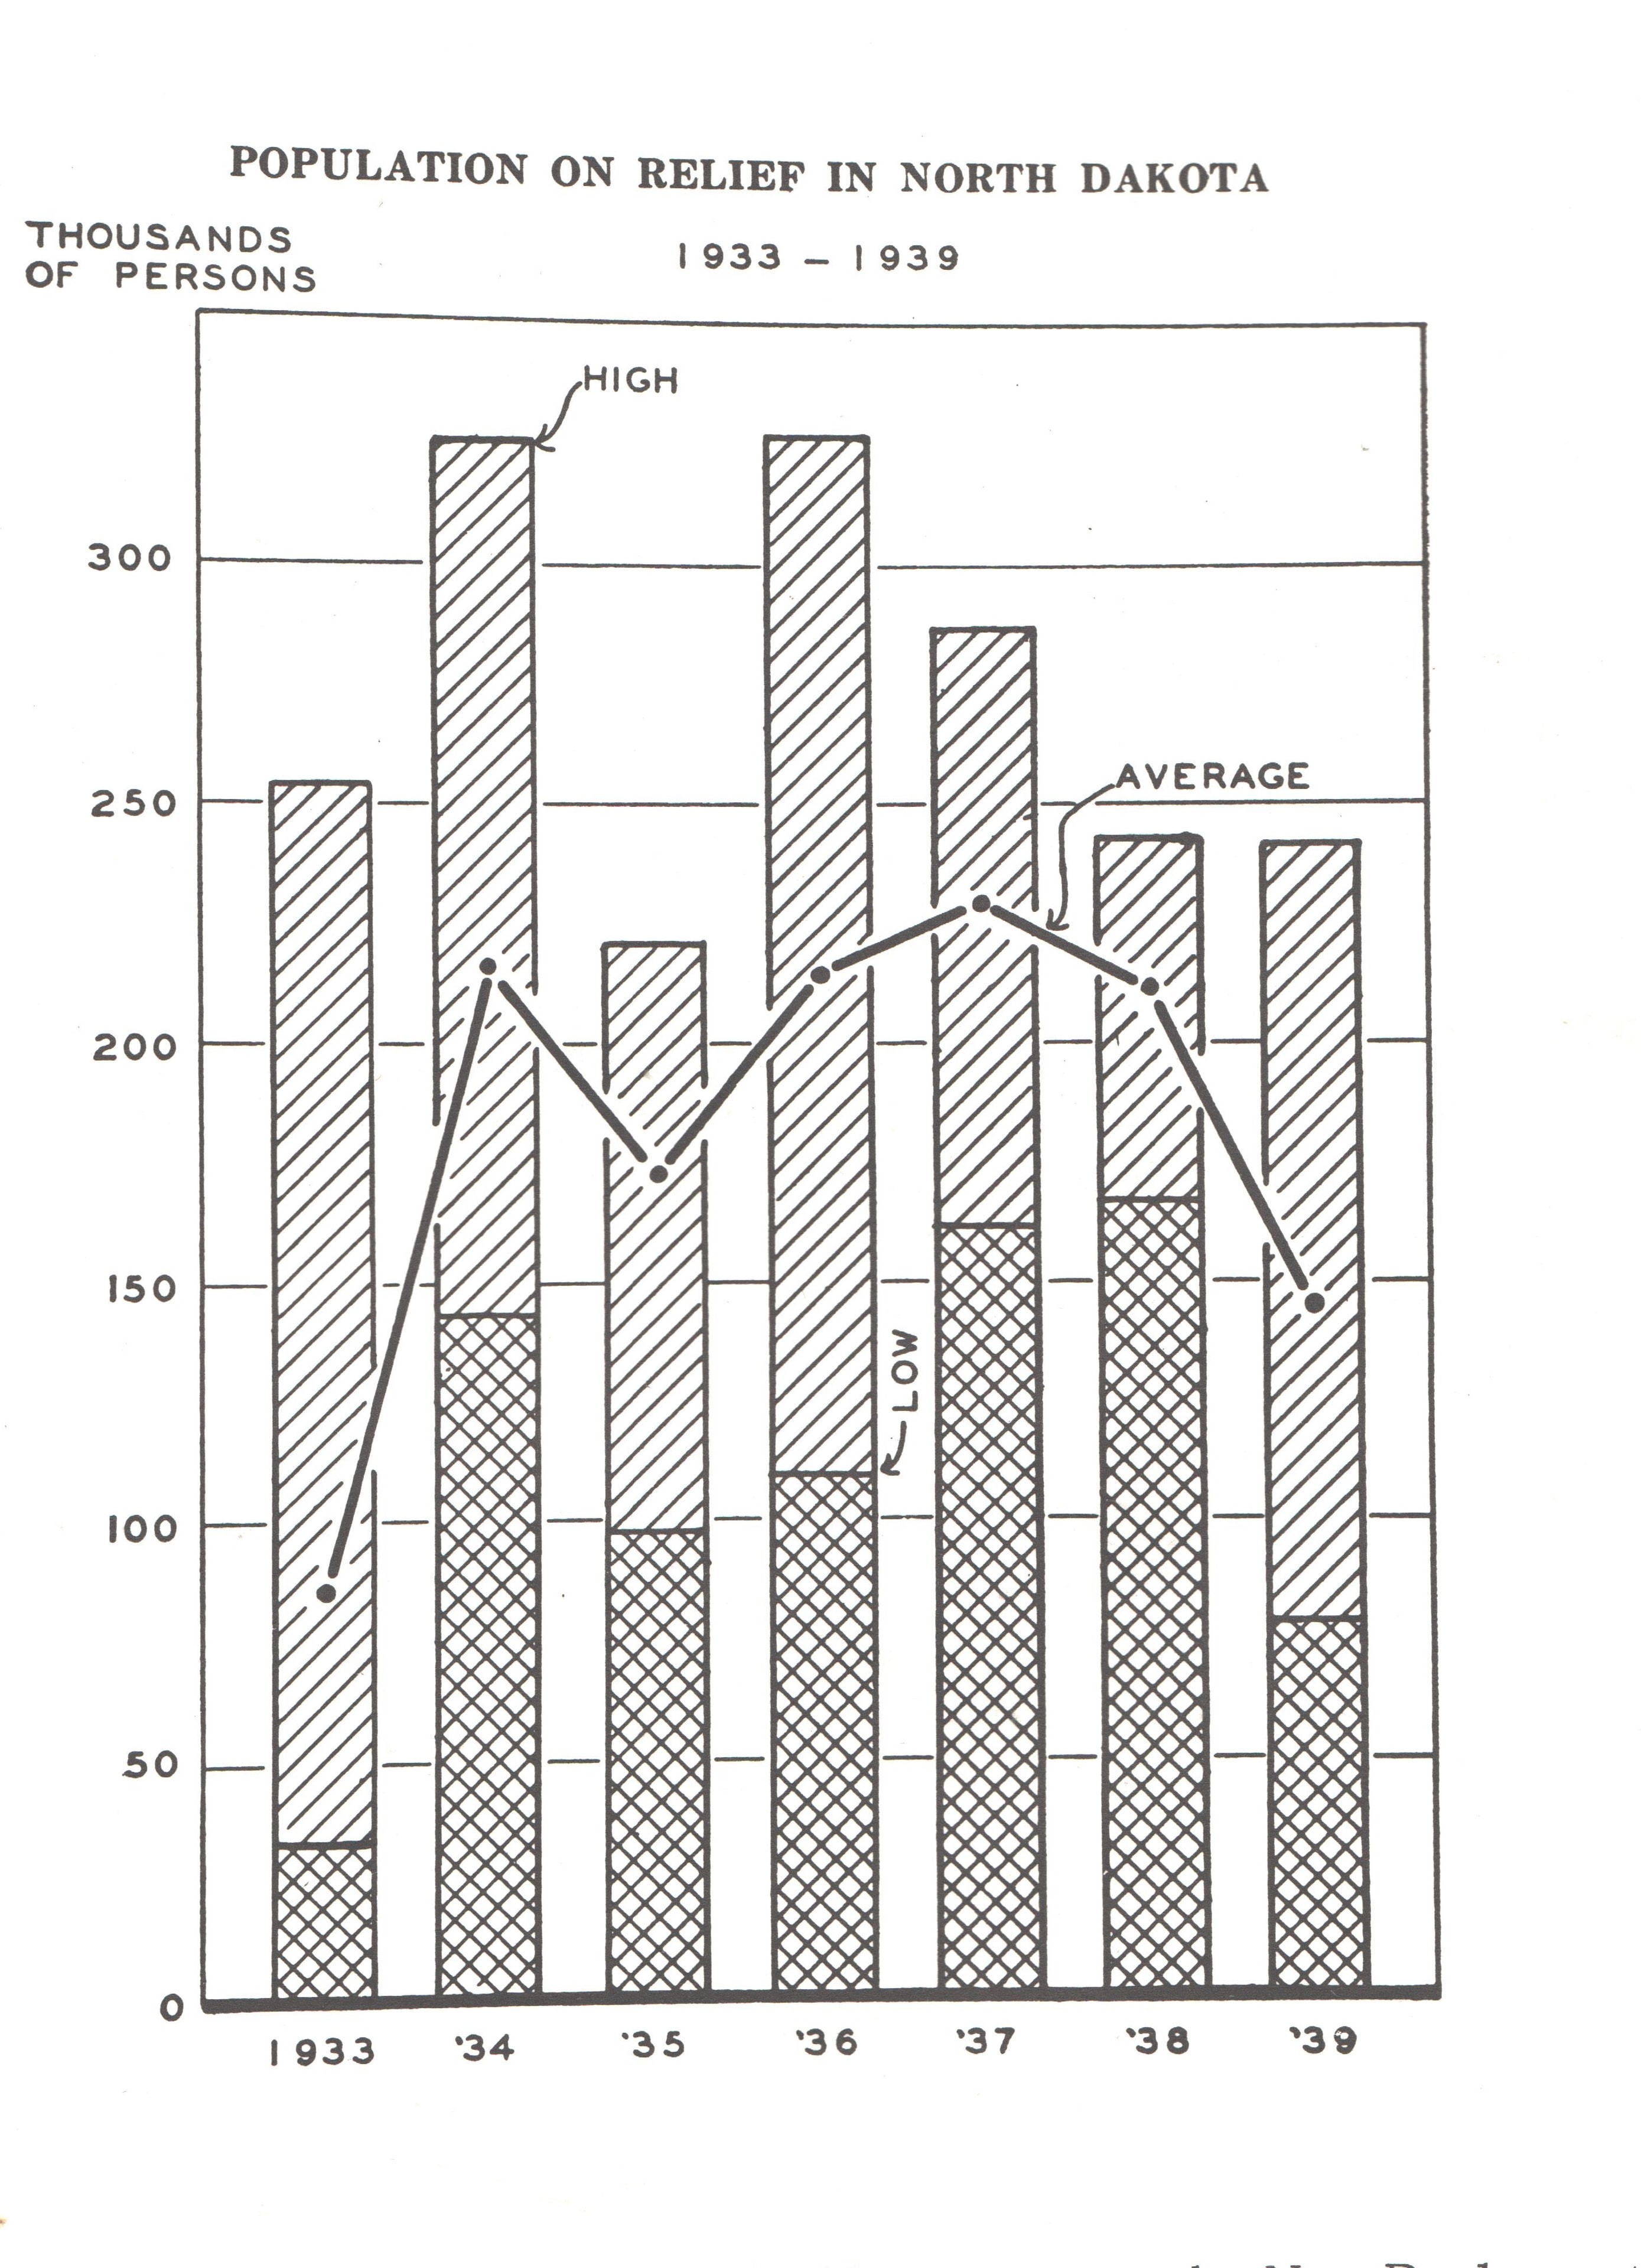
Population on Relief in North Dakota, 1933–1939. (Graphic courtesy Tweton and Rylance, Years Of Despair: North Dakota In The Depression. Original available at the Elwyn B. Robinson Department of Special Collections, Chester Fritz Library, UND)